ARR:n (absolute risk reduction) ja RRR:n (relative risk reduction) eroista
On Anoi Kaa kirjoitti: Su Tammi 02, 2022 3:47 pm
Rokote ei myöskään ehkäise vakavia sairastumisia siten, miten meille aina näihin päiviin on uskoteltu eli se 95% teho (alussa) oli tilastokikka, missä halusivat markkinoida rokotetta RRR-luvun mukaan, ei todellisen riskin vähentymisen eli ARR:n mukaan. Rokotettuja on joutunut koko ajan sairaalaan ja nyt talven tultua tämä määrä on kiihtynyt, kuten mRNA-asiantuntijat osasivat jo kesällä kertoa (koska teho hiipuu ja uusia variantteja, talvi on otollinen hengitystievirukselle, kun THL ei valista ihmisiä miten parantaa vastustuskykyään, jne.)
Absoluuttinen riski eli ARR pieneni parhaimmillaankin vain 0,84% ja sen voi kuka tahansa laskea (tai selvittää* esimerkiksi viimeksi eilen tai toissapäivänä linkkamani 2 min videon perusteella) kelvottoman, vain 2 kuukauden jälkeen tarkoituksella tuhotun kliinisen kokeen luvuista.
Korona on ensimmäinen tauti, missä länsimainen lääketiede on nostanut kätensä pystyyn, jättänyt turvalliset ja tehokkaat lääkkeet käyttämättä. AINA ennen ovat olemassaolevat lääkkeet olleet se ensimmäinen keino, mutta nyt ne kiellettiin heti alussa ja otettiin esimerkiksi kokeellinen ja vaaralliseksi tiedetty remdesivir (tehoton ja vaarallinen, maksaa tuhansia euroja/potilas) käyttöön, vaikka siitä ei ollut senkään veroista dataa, millä perusteella lääketeollisuus kielsi turvallisten ja edullisten lääkkeiden määräämisen. Tämäkään ei herättänyt mitään ihmetystä kuoliaaksipelotelluille.
On Anoi Kaa kirjoitti: Su Tammi 02, 2022 2:24 pm
- Lisänä se, että Pfizer-Biontechin kelvottoman kliinisen tutkimuksen datasta voi kuka tahansa laskea, että rokote pienentää absoluuttista riskiä vain 0,84% ja se ilmoitettu 95% on taas suhteellinen riskinvähennys. Kannattaa oikeasti selvittää, miten Pfizer ja media on meitä huijannut tuollakin ilmoitetulla teholla RRR, kun ovat taas olleet hiirenhiljaa ARR-luvusta eli absoluuttisesta riskin pienentymisestä. Toki molemmat luvut ovat sukeltaneet vielä alas tuosta.
- Oikeasti olisi pitänyt heti näyttää, että kuinka monta ihmistä tulee "rokottaa", jotta saataisiin yksi kuolema tai vakava sairastuminen estettyä ja sitten ottaa huomioon itse rokotteen aiheuttamat kuolemantapaukset ja vakavat sairastumiset (mitkä muuten eivät ole aina edes hoidettavissa toisin kuin vakava korona on ollut jo alusta asti useimmiten, jos on haluttu ja osattu hoitaa).
teppo kirjoitti: Su Tammi 02, 2022 4:01 pm
Tässä porukassa aika harvalla on resursseja tehdä asiassa "omaa tutkimusta".
Mielestäni tämä ARR (absolute risk reduction) ja RRR (relative risk reduction) on ihan koulumatematiikan avulla ymmärrettävissä. Alla pienimuotoista johdantoa noiden kyseisten lukujen taakse. Lopussa on vielä Pfizerin julkaisemista luvuista joitakin aihepiiriin liittyviä laskutoimituksia.
For instance, supposing that a well-designed randomised controlled trial in children with a particular disease found that 20 per cent of the control group developed bad outcomes, compared with only 12 per cent of those receiving treatment. Should you agree to give this treatment to your child? Without knowing more about the adverse effects of the therapy, it appears to reduce some of the bad outcomes of the disease. But is its effect meaningful?
This is where you need to consider the risk of treatment versus no treatment. In healthcare, risk refers to the probability of a bad outcome in people with the disease.
Absolute risk reduction (ARR) – also called risk difference (RD) – is the most useful way of presenting research results to help your decision-making. In this example, the ARR is 8 per cent (20 per cent - 12 per cent = 8 per cent). This means that, if 100 children were treated, 8 would be prevented from developing bad outcomes. Another way of expressing this is the number needed to treat (NNT). If 8 children out of 100 benefit from treatment, the NNT [number needed to treat] for one child to benefit is about 13 (100 ÷ 8 = 12.5).
For technical reasons, some other measures are often used. The relative risk (RR) of a bad outcome in a group given intervention is a proportional measure estimating the size of the effect of a treatment compared with other interventions or no treatment at all. It is the proportion of bad outcomes in the intervention group divided by the proportion of bad outcomes in the control group. In this hypothetical case, the RR is 0.6 (12 per cent ÷ 20 per cent = 0.6).
When a treatment has an RR greater than 1, the risk of a bad outcome is increased by the treatment; when the RR is less than 1, the risk of a bad outcome is decreased, meaning that the treatment is likely to do good. For example, when the RR is 2.0 the chance of a bad outcome is twice as likely to occur with the treatment as without it, whereas an RR of 0.5 means that the chance of a bad outcome is twice as likely to occur without the intervention. When the RR is exactly 1, the risk is unchanged. For example, a report may state ‘The relative risk of blindness in people given drug T was 1.5’. This shows that the drug increased the risk of blindness. Another measure that is used is the odds ratio. For practical purposes, assume that the odds ratio is the same as the relative risk. Sometimes the outcome is a good one and the interpretation of relative risk is the opposite of what we have just outlined.
Relative risk reduction (RRR) tells you by how much the treatment reduced the risk of bad outcomes relative to the control group who did not have the treatment. In the previous example, the relative risk reduction of fever and rash in the group of the children on the intervention was 40 per cent (1 – 0.6 = 0.4 or 40 per cent).
https://www.ncbi.nlm.nih.gov/books/NBK63647/
Kyllä kai molemmat sekä RRR että ARR ovat tärkeitä lukuja, mutta suuren yleisön olisi mielestäni syytä olla tietoinen, mitä nuo ilmoitetut luvut oikein ilmaisevat, ja miten ne oikein on laskettu. Mielestäni RRR:n ja ARR:n (sekä aiemmin edellä monessa viestissä debatoidun OAK:n esille tuoman taulukon) kohdalla kohorttiryhmien/tarkasteltavien ryhmien (lukumääräinen) ryhmäkoko
(sekä taudin ilmaantuvuusaste eri ikäryhmissä sekä taudin tyypillinen vakavuuden laatu taustaryhmittäin jaoteltuna) olisi myös syytä aina pitää mielessä.
It’s actually pretty rare (especially in my world of oncology) to see Absolute Risk Reduction reported in a study. You’ll find that you have to calculate it for yourself. But if it’s so important, why do you have to manually calculate it for most studies? Why isn’t it reported with the findings?
Simply put, Absolute Risk is less sexy than Relative Risk. It doesn’t make for good press headlines. If Absolute Risk is the Jan Brady of the research world, Relative Risk is its Marcia. In the world of press releases, Relative Risk is the younger, more attractive cousin of Absolute Risk.
(...)
Time for some vocabulary. The Absolute Risk is the total risk of a given 'thing' occurring after all risk factors and confounding variables are summed up. For example you could sum up your lifetime risk of having and
atherosclerotic event based on the incidence and prevalence of your demographic.
Relative risk is different. It's the risk of a given 'thing' in comparison (ie. relative) to something else. For example, your risk of developing a DVT if you're a smoker compared to if you weren't a smoker.
When we talk about Relative Risk Reduction (RRR) and Absolute Risk Reduction (ARR), we're talking about an intervention. We're reducing the absolute and relative risk by giving some treatment. The absolute risk reduction is the total reduction in risk that results by choosing a given treatment. This number is often very different from the relative risk reduction.
With RRR, the reduction of risk is compared to some other group. You could compare the effectiveness of
Entresto in reducing mortality from heart failure to an existing treatment like enalapril. Or you could compare Paxil CR to no intervention (placebo) at reducing symptoms of depression.
Great. So what does all of that mean to you as a clinician?
You can have a lot of fun with relative risk…
For example, let’s say that I’m afraid of flying (not because of COVID, I’m just scared of dying in a plane crash). To mitigate that fear, I could choose to no longer fly in planes. Doing so would drop my relative risk of dying in a fiery plane crash to almost zero. We’d be comparing the relative risk of the following:
Me dying in a plane crash assuming I travel via plane
Me dying in a plane crash assuming I do not travel via plane
By choosing NOT to fly in planes, maybe my relative risk of dying in a plane crash would be somewhere around 99.999% (because a fiery plane could crash into me while I'm doing yard work or something). That’s a HUGE reduction, and a very attractive number. Wouldn’t you want to reduce your risk of dying in a plane crash by 99.99%?
But you have to ask yourself… what is the baseline risk of dying in a plane crash (even if you DO fly in planes)? We have access to this data, and your absolute risk is
0.000009%. A 99.999% reduction from 1 in 11 million isn't nearly as headline worthy, is it? Can you imagine imagine an ad for this when you’re scrolling through you IG feed?
“Man uses this 1 SIMPLE TRICK to reduce his risk of dying in a plane crash by 0.000009%”
Not very exciting. Much less sexy than 99.99%.
Let's keep going with the heart failure medication Entresto. You have
a study that shows a 19.4% relative risk reduction of cardiovascular death in heart failure patients using Entresto compared to enalapril. If you were practicing a few years ago when it first came out, you probably saw news stories boldly claiming that
Entresto reduces your risk of death by 20% (because rounding). If you were to look at those studies and calculate absolute risk reduction, you’d find that it was 3.2%.
3.2% mortality reduction for a disease as common as heart failure is nothing to sneeze at (this study was actually stopped early due to the benefit seen in the Entresto group). But you probably don't need me to tell you that 3.2% is wayyyyyyyy less than 20%.
And that's what we're driving at with absolute risk here. It helps to lend you perspective to the equation.
https://www.tldrpharmacy.com/content/ab ... -reduction
Kaavat:
CER (control event rate) = huonojen lopputulosten lukumäärä kontrolliryhmässä / kontrolliryhmän ryhmäkoko
EER (experimental event rate) = huonojen lopputulosten lukumäärä rokotteen saaneiden keskuudessa / rokotteen saaneiden henkilöiden lukumäärä
ARR (absolute risk reduction) = control event rate (CER) - experimental event rate (EER)
NNT (number needed to treat) = 1 / ARR
RR (risk reduction) = CER / EER
RRR (relative risk reduction) = (CER - EER) / CER
RRR (relative risk reduction) = 1 - RR
Pfizerin rokotteen luvut phase 3 vaiheen tutkimustulosten perusteella:
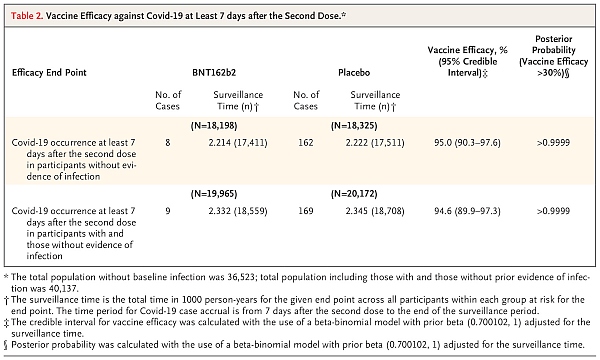
- https://www.nejm.org/doi/full/10.1056/nejmoa2034577 (Table 2, s.10 / s.2612)
- Safety and Efficacy of the BNT162b2 mRNA Covid-19 Vaccine.jpg (84.94 KiB) Katsottu 1678 kertaa
ARR = (169/18708) - (9/18559) = 0,90336 % - 0,04849 % = 0,8549 %
- Eli jos 1000 henkilöä rokotetaan, niin ymmärtääkseni 8 heistä välttyy huonolta lopputulokselta [pyöristys alas kokonaislukuun].
NNT = (1 / 0,8549 %) = 117
- Eli jotta yksi huono lopputulos saataisiin estettyä, nähdäkseni pitäisi rokottaa 117 henkilöä.
RR = 0,04849 % / 0,90336 % = 0,054
- Tästä en ole ihan varma, mutta nähdäkseni siis huono lopputulos olisi kaiketi keskimäärin odotettavissa noin reilu 18-kertaisesti useammin ilman rokotetta kuin rokotteen kanssa. Tässä tosin on mielestäni hyvä huomata, että molemmat todennäköisyydet ovat melko pieniä, vain joitakin prosentin murto-osia.
RRR = (0,90336 % - 0,04849 %) / 0,90336 % = 94,6 %
RRR = 1 - 0,054 = 94,6 %
- Pelkkä perinteinen muutosprosentin laskenta (EER-CER) / CER antaa siis negatiivisen arvon, jos rokote toimi odotetulla tavalla. Relatiivinen riskin vähennys (RRR) näyttäisi olevan tuon luvun vastaluku, koska kerran riskin vähentämisestä puhutaan.
Näin ollen nähdäkseni em. tutkimuksen mukaan Pfizer tarjoaa 94,6 % vähennyksen siihen taudin saamisen todennäköisyyteen, mikä havaittiin Covidin yleisyydeksi tutkimuksen verrokkihenkilöiden keskuudessa (alle 1 % verrokkihenkilöistä havaittiin sairastuneen Covid-19:ään), eli siis Pfizer tarjoaa 94,6 % vähennyksen 0,903 %:sta, joten vaikka prosenttilukuja tarkastellessa (suhteellisten osuuksien eroissa) vähennys on suuri, niin absoluuttinen henkilömäärä, joita nämä luvut koskevat, on kuitenkin melko pieni. Sitten taasen, kun rokotteita annetaan miljardeittain, niin näille prosenttiosille alkaa tulla reaalimaailman katetta: ymmärtääkseni ARR:n mukaan laskettuna jos (ja kun) miljardi ihmistä saataisiin rokotettua, niin yli 800000 henkilöä välttyisi huonolta lopputulokselta. Vastaavasti tosin sitten myös ne vähäiset todetut rokotehaitat lukumääräisesti myös yleistyvät, jos puhutaan miljardien suuruusluokasta. Mielestäni rokotteiden haittavaikutukset tulisi kyllä laskea mukaan huonoihin lopputuloksiin (Covid-tapausten rinnalle) laskutoimituksia tehtäessä.
Itselleni näitä lukuja pyöritellessä heräsi mieleen osakemarkkinaesimerkki: jos omistaa 100 osaketta ja kuukauden nousuprosentti osakkeilla on ollut 94,6 %, niin se, että onko aihetta todelliseen iloon, riippuu pitkälti osakkeiden lähtöarvosta: 0,903 €:n hintaisille osakkeille nousua nähdäkseni kertyi kuukaudessa 85,4 €, mutta jos lähtöarvo per osake oli siellä 2500 € kohdalla, niin arvonnousua ilmeisesti tuli kuukaudessa 236500 €.
Mielestäni kovin ansiokkaan kriittisesti tuossa OAK:n linkkaamassa
PDF:ssä (jota damfin kutsui "'kanukkiasiantuntijoiden' vedätykseksi") oli luettu noita Pfizerin julkaisemia tutkimuksia. Monen kiinnostavan huomion ohella eritoten sivujen 21-23 väite siitä, että Pfizerin tutkimuksissa ei olisi systemaattisesti testattu kaikkia osallistujia, vaan että yksittäisten tutkijoiden harkintavaltaan jäi valita ne henkilöt, joita COVID-19-oireiden perusteella testattattiin, nosti epäilyksen varjon tutkimusjärjestelyitä kohtaan sekä herätti minulle useita kysymyksiä tutkimuksen toistettavuudesta - täten siis oireettomat Covid-tapaukset jäivät kokonaan tarkastelun ulkopuolelle poisrajattujen ryhmien, kuten nuorten, lapsien, raskaana olevien ja alentuneen immuunipuolustuksen omaavien henkilöiden tavoin. Samoiten väitetty "huonojen" tapausten rajaaminen tutkimuksen ulkopuolelle vaikuttaa minusta epäilyttävältä -
Maddie de Garayn caseen liittyen väitteenä on myös esitetty, ettei vapaakenttää haittavaikutusten ilmoittamiseen käytetyssä kyselylomakeapplikaatiossa ollut lainkaan, jolloin haittavaikutusten osalta siis oltaisiin havaittu ainoastaan niitä oireita, joita olisi etukäteen osattu etsiä.
Covid-19:n todentamisesta ja todentamattomuudesta Pfizerin tutkimuksissa
Confirmed Covid-19 was defined according to the Food and Drug Administration (FDA) criteria as the presence of at least one of the following symptoms: fever, new or increased cough, new or increased shortness of breath, chills, new or increased muscle pain, new loss of taste or smell, sore throat, diarrhea, or vomiting, combined with a respiratory specimen obtained during the symptomatic period or within 4 days before or after it that was positive for SARS-CoV-2 by nucleic acid amplification–based testing, either at the central laboratory or at a local testing facility (using a protocol-defined acceptable test).
https://www.nejm.org/doi/full/10.1056/nejmoa2034577
Suspected COVID-19 Cases
As specified in the protocol, suspected cases of symptomatic COVID-19 that were not PCR-confirmed were not recorded as adverse events unless they met regulatory criteria for seriousness.
(...)
Among 3410 total cases of suspected but unconfirmed COVID-19 in the overall study population, 1594 occurred in the vaccine group vs. 1816 in the placebo group. Suspected COVID-19 cases that occurred within 7 days after any vaccination were 409 in the vaccine group vs. 287 in the placebo group. It is possible that the imbalance in suspected COVID-19 cases occurring in the 7 days postvaccination represents vaccine reactogenicity with symptoms that overlap with those of COVID-19. Overall though, these data do not raise a concern that protocol-specified reporting of suspected, but unconfirmed COVID-19 cases could have masked clinically significant adverse events that would not have otherwise been detected.
https://www.fda.gov/media/144245/download (pdf, ~1,1Mt, s.42; FDA Briefing Document Pfizer-BioNTech COVID-19 Vaccine)
Eli FDA:lle joulukuussa 2020 toimittamassaan tiedotteessa Pfizer mainitsi, että huomattavan suurella joukolla testihenkilöitä (9,1 % rokotetuista ja 10,4 % verrokkiryhmäläisistä) havaittiin Covid-19:n kaltaisia oireita, mutta joita mielestäni kummallisista tutkimusjärjestelyistä johtuen ei lainkaan testattu PCR-testillä. Tähän seikkaan tarttui tuo kanadalaisryhmä kritiikissään julkaisten mm. ao. taulukon, missä on hyvin esitetty kunkin ryhmän ryhmäkokoja. Vasemmanpuoleisin palkkipari kuvaa RRR:ää siten kuin tutkimuksessa se saatiin selville (ylläolevan table 2:n ylempien lukujen mukaisesti, eli 95%). Keskimmäinen palkkipari kuvaa tuota suurta joukkoa, joilla havaittiin Covid-19-oireita, mutta joiden tartuntaa jostain käsittämättömästä syystä ei missään vaiheessa varmistettu PCR-testeillä. Näin ollen mielestäni tämän tutkimuksen kohdalla lepää hyvin suuri tietämättömyyden varjo, jos noin joka kymmenennestä koehenkilöistä ei tiedetä, että sairastuivatko he vaiko eivät, eritoten kun vielä tuolla porukalla näytti olleen Covid-19-oireita. Oikeanpuoleisinta palkkiparia ei mielestäni voi kuin vain ideatasolla esittää, sillä emme todellakaan voi enää tietää, mikä tämän "harmaan", oireilevan kymmenesosan tautistatus todellisuudessa oli. Oikeanpuoleisimmat palkit kuvaavat lähinnä worst-case-scenariota, missä kaikilla oireilevilla olisi ollut Covid-19(, mutta sitähän me emme voi tietää, kun testausta ei kaikille järjestetty). Joka tapauksessa silti tuo oikeanpuoleisin palkkipari kuvaa sitä, kuinka RRR-arvo voi muuttua dramaattisesti Covid-19 tapausten ja muiden haitallisten tapausmäärien vaihdellessa.
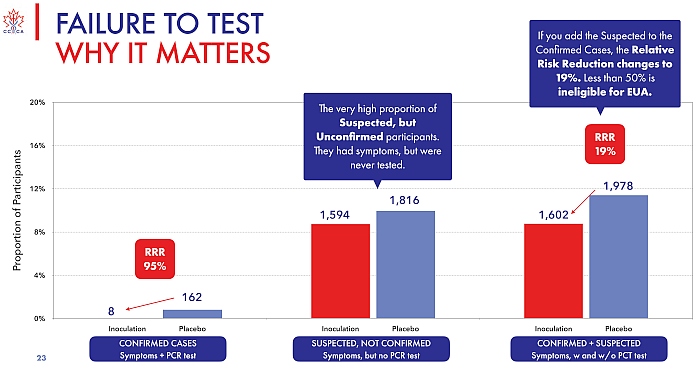
- https://www.canadiancovidcarealliance.org/ (Pfizer's inoculations for Covid-19, s.23)
- Failure to Test - Why it Matters.jpg (82.19 KiB) Katsottu 1678 kertaa
Safety and Efficacy of the BNT162b2 mRNA Covid-19 Vaccine through 6 Months
https://www.nejm.org/doi/10.1056/NEJMoa2110345
Supplementary Appendix (missä haittavaikutuksia on käyty läpi):
https://www.nejm.org/doi/suppl/10.1056/ ... pendix.pdf (pdf, 461 kt)
Pfizer-Biontech Covid-19 Vaccine: Fact Sheet For Healthcare Providers Administering Vaccine (vaccination Providers)
https://labeling.pfizer.com/ShowLabeling.aspx?id=14471 (pdf, ~3,5Mt)
Eräs laskuharjoitus:
Outcome Reporting Bias in COVID-19 mRNA Vaccine Clinical Trials
https://pubmed.ncbi.nlm.nih.gov/33652582/
Hyvä vastine ARR ja NNT lukujen yksipuoliselle käyttämiselle:
COVID-19 vaccines: effectiveness and number needed to treat
https://www.thelancet.com/journals/lanm ... 1/fulltext

